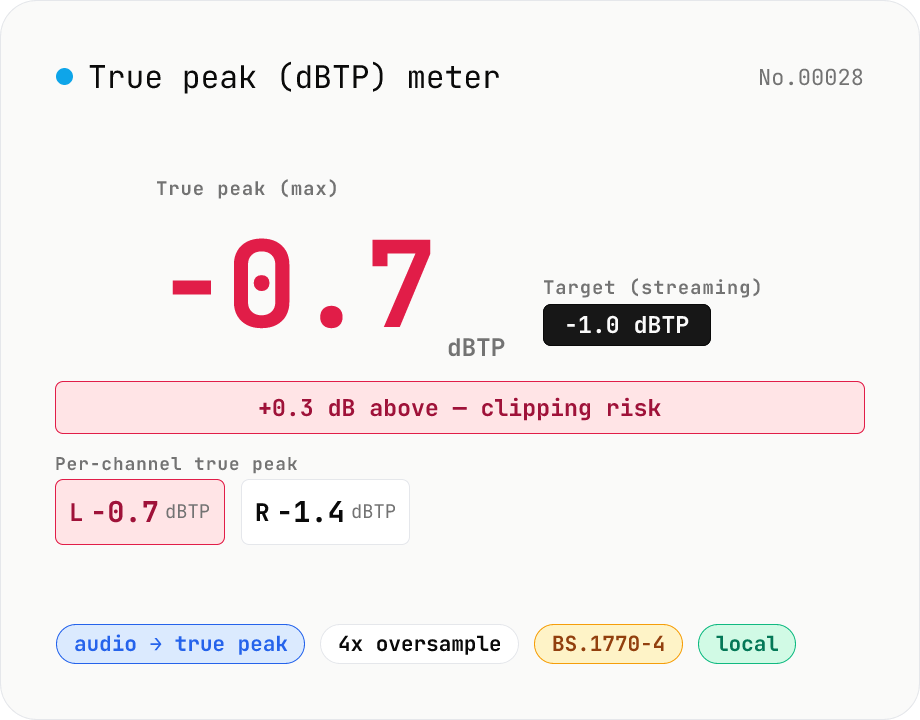
True Peak (dBTP) meter — detect inter-sample peaks via 4x oversampling
Drop an audio file (MP3 / WAV / M4A / FLAC / OGG / Opus) to measure True Peak (dBTP) using ITU-R BS.1770-4 Annex 2-compliant 4x oversampling (poly-phase FIR low-pass) to reveal inter-sample peaks invisible to sample-peak meters. Spots clipping that emerges after MP3 / AAC encoding so you can pull back the limiter before it shows up downstream. Compare against streaming targets (Spotify / Apple Music / EBU R128 = -1.0 dBTP, YouTube = -1.0 dBTP, broadcast = -2.0 dBTP) and see which channel is hottest at a glance. Audio stays in your browser.
How to use
Drop or pick one or more audio files (MP3 / WAV / M4A, etc.). Pick the target (streaming = -1.0 dBTP, broadcast = -2.0 dBTP, lossless = -0.1 dBTP). The result card shows the overall True Peak (max across channels), per-channel True Peak, and Sample Peak. Anything above 0 dBTP is flagged red — typical of clipping that appears only after MP3 / AAC encoding. Pull the limiter back 1–2 dB and re-export.
In depth
True Peak measurement is the last step before the master leaves the studio
Checking dBTP happens at the final stage: the mixed, mastered, limiter-processed candidate for delivery to a distributor. The file on the table is the one the engineer is ready to submit — or would be, pending this measurement. It’s as polished and as unreleased as audio gets.
True Peak requires 4x oversampling to compute — not a trivial operation on long files. The temptation to use an online tool for this step is real. What the online tool receives is the final master. For music where the delivery deadline is imminent and the rights haven’t cleared yet, this is an uncomfortable trade.
What online audio checkers receive when you verify True Peak
Dedicated True Peak meters are less common online than loudness checkers, but loudness services often include dBTP alongside LUFS. Server-side processing means the master file arrives at the service’s infrastructure. Terms of service for free utilities frequently include usage rights over uploaded content — rights that, in practice, cover the final masters submitted for measurement.
Beyond the audio content, the measurement result encodes characteristics of the dynamic structure of the work: limiter behaviour, peak distribution, codec margins. A server that records this metadata alongside the file knows something meaningful about the music even if the audio itself is later deleted.
49-tap Kaiser-windowed sinc FIR does 4x interpolation inside the browser
The tool decodes audio with decodeAudioData and OfflineAudioContext, then applies a 49-tap Kaiser-windowed sinc low-pass filter split into four poly-phase sub-filters to interpolate between adjacent samples. This implements the ITU-R BS.1770-4 Annex 2 reference design: the interpolated peak values between measured samples are the True Peak. Validation against sine-wave and silence test signals confirms the result matches the reference implementation within a fraction of a dB.
The poly-phase filter computation runs inside browser memory. Open DevTools Network and measure a file: no requests appear after the initial load. The Kaiser window parameters and the poly-phase filter construction are in the GitHub source.
Closing the pre-delivery loop inside the browser
True Peak and LUFS are complementary measurements — run both before submitting to a distributor. The standard streaming delivery target is Integrated LUFS -14 + True Peak -1.0 dBTP. Running both checks with audio-loudness-lufs and this tool takes less than a minute and keeps the master off any external server.
If True Peak reads above 0 dBTP, the practical fix is to pull the limiter ceiling back 1–2 dB in the DAW and re-export, then verify here again. When you’d rather avoid the DAW round-trip, audio-volume applies a flat attenuation in a couple of seconds so you can re-measure. To see exactly where the peak sits, audio-waveform renders the amplitude envelope and audio-spectrum shows the band where the energy is concentrated — both in-browser. The master doesn’t reach an external system until the distributor upload, which is exactly when it’s supposed to.
Inter-sample peaks vs. sample peaks — why dBTP differs from dBFS
Sample Peak (dBFS) is the maximum absolute value across discrete PCM samples — a number you can read directly from the file. True Peak (dBTP) accounts for the continuous waveform a DAC’s reconstruction filter will produce between sample points, including Inter-sample Peaks that occur between adjacent samples. A track measuring -0.1 dBFS at the sample level can easily reach +0.5 dBTP after reconstruction.
The reason the reconstructed peak can exceed sample values comes from Nyquist-Shannon: PCM is recorded under the assumption that a perfect sinc-interpolated continuous signal can be recovered. Real-world DACs, and the subsequent processing inside MP3 / AAC encoders, produce waveforms whose peaks sit above the original PCM max. The effect is strongest on high-frequency-heavy material and on heavily limited tracks, where Inter-sample Peaks of +1 to +3 dBTP are common. This is the underlying cause of “mysterious clipping” that appears only after upload to a streaming service.
Loudness and True Peak targets across delivery platforms
Each streaming and broadcast platform publishes loudness normalisation specs that also pin down a True Peak ceiling. Spotify is Integrated -14 LUFS / -1.0 dBTP, Apple Music is -16 LUFS / -1.0 dBTP (Sound Check), YouTube is -14 LUFS / -1.0 dBTP, Amazon Music is -14 LUFS / -2.0 dBTP, Tidal is -14 LUFS / -1.0 dBTP, SoundCloud is approximately -14 LUFS (no official figure). Broadcast standards vary by region: EBU R128 targets Integrated -23 LUFS / -1.0 dBTP, US ATSC A/85 (CALM Act) targets -24 LKFS, Japan’s TR-B32 targets -24 LKFS.
The modern streaming consensus is roughly -14 LUFS / -1.0 dBTP. Mastering louder than that (-9 LUFS, for example) just causes the platform to attenuate playback — the loudness war has structurally ended at the distribution layer. Going significantly quieter than -16 LUFS produces inconsistent results: some services (Apple Music Sound Check, ReplayGain-style) only gain up at playback, while Spotify’s Loudness Normalization behaves differently depending on each user’s playback preference. Knowing both Integrated LUFS and True Peak of the final master lets you decide whether you need platform-specific exports or a single delivery file.
FAQ
- Sample peak vs. true peak — what's the difference?
- Sample peak is the largest absolute value across the samples (dBFS). True peak interpolates between samples (4x oversampling) to estimate the actual waveform peak. A track can read -0.3 dBFS at the samples but +0.8 dBTP at the interpolated peak — clipping that shows up after MP3 / AAC re-encoding.
- Why do streaming services aim for -1.0 dBTP?
- Spotify / Apple Music / YouTube Music re-encode incoming audio to AAC or Opus. Re-encoding can push true peak up by 0.5–1.0 dB, so leaving 1 dB of headroom (-1.0 dBTP) prevents clipping after the platform's transcode.
- How does the 4x oversampling work?
- We split a 49-tap Kaiser-windowed sinc low-pass into four poly-phase filters and interpolate the samples between adjacent inputs. The filter follows the spirit of the ITU-R BS.1770-4 Annex 2 reference and matches it within a fraction of a dB on test signals.
- Does it measure LUFS?
- No — this tool focuses on True Peak and Sample Peak. For Integrated LUFS / LRA use audio-loudness-lufs. The recommended workflow is to measure both before exporting for streaming.
- Is the audio uploaded?
- No. We use the Web Audio API (decodeAudioData + OfflineAudioContext) plus an in-browser FIR — nothing leaves your machine.
How to verify nothing is uploaded
This tool never sends your input outside your browser. The pages below explain how it works, how to audit it, and how the site is run.
Related tools
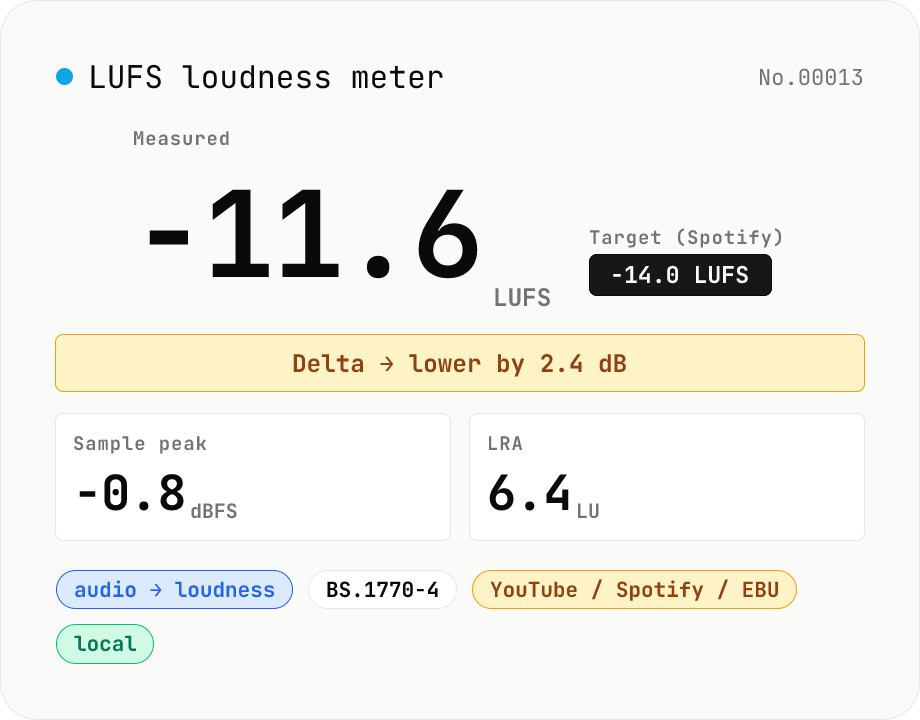
LUFS loudness meter — measure integrated loudness vs. streaming targets
Drop an audio file (MP3 / WAV / M4A / FLAC / OGG / Opus) to measure ITU-R BS.1770-4 Integrated Loudness (LUFS) / Loudness Range (LRA) / Sample Peak (dBFS) in your browser. Pick a streaming target (YouTube / Apple Music / Amazon Music: -14 LUFS, Spotify: -14 LUFS, Apple Podcasts: -16 LUFS, EBU R128 / broadcast: -23 LUFS) to see the delta in LU — telling you how many ±dB to push through audio-volume to match. Implements a K-weighting biquad, 400 ms square-window blocks, and absolute (-70 LUFS) + relative (-10 LU) gating, with ITU channel weights (L=R=C=1). Audio stays in your browser.
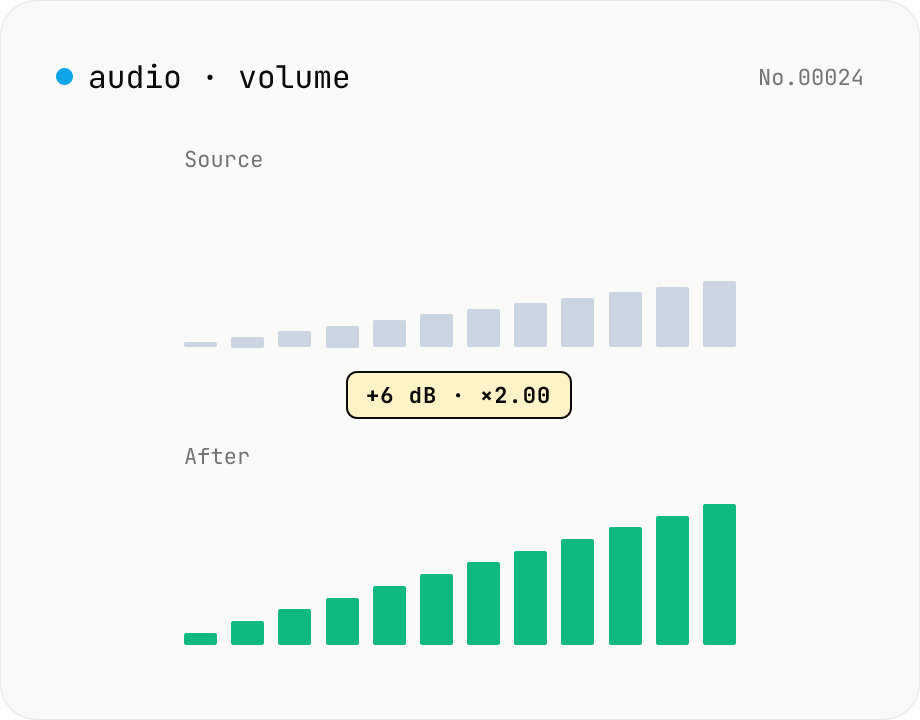
Audio volume — adjust by dB or linear multiplier
Adjust the loudness of audio files in bulk via ffmpeg.wasm's volume filter. Use the dB slider (-30 to +30 dB) or the linear multiplier (×0.03 to ×31.6). +6 dB ≈ 2x, -6 dB ≈ half. To avoid clipping, try negative values first and compare. Supports batch processing and a single ZIP download. Runs entirely in your browser — audio never leaves your device.
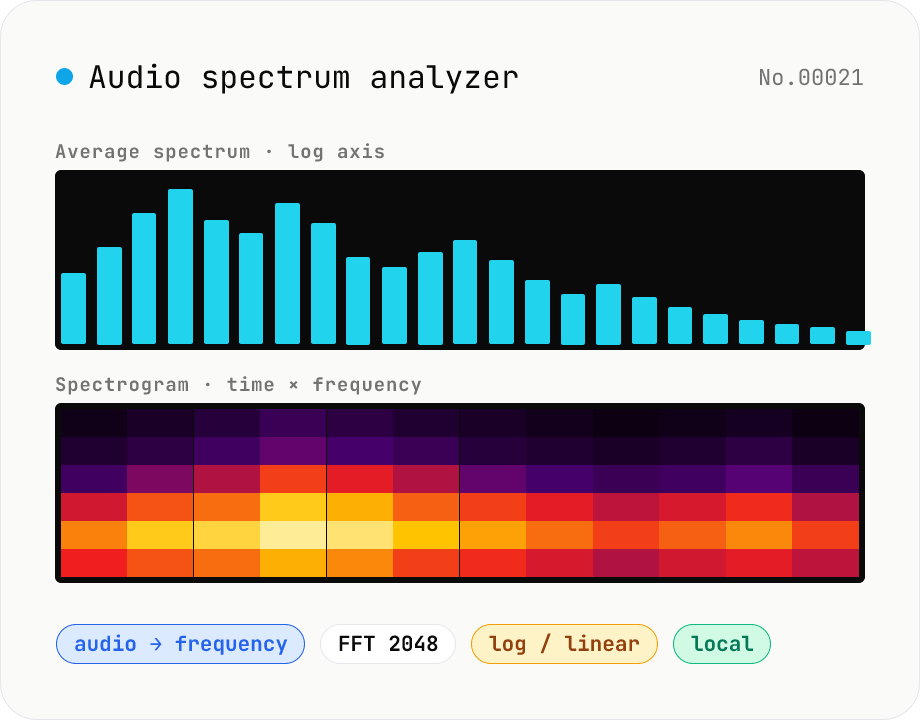
Audio spectrum analyzer — visualize frequency content
Drop an audio file (MP3 / WAV / M4A / FLAC / OGG / Opus) to run an in-browser FFT analysis and visualize its frequency content. A Mode toggle switches between the average spectrum (frequency vs. amplitude over the whole file) and a spectrogram (time × frequency × amplitude). Pick the FFT size (512 / 1024 / 2048 / 4096) and the frequency axis (linear / log). Useful for checking the low end before mastering, locating noise bands, inspecting an instrument's harmonic structure, or sanity-checking the S/N ratio of a lecture recording. Download the canvas as PNG, or export the average spectrum as CSV. Everything runs in your browser — no upload.
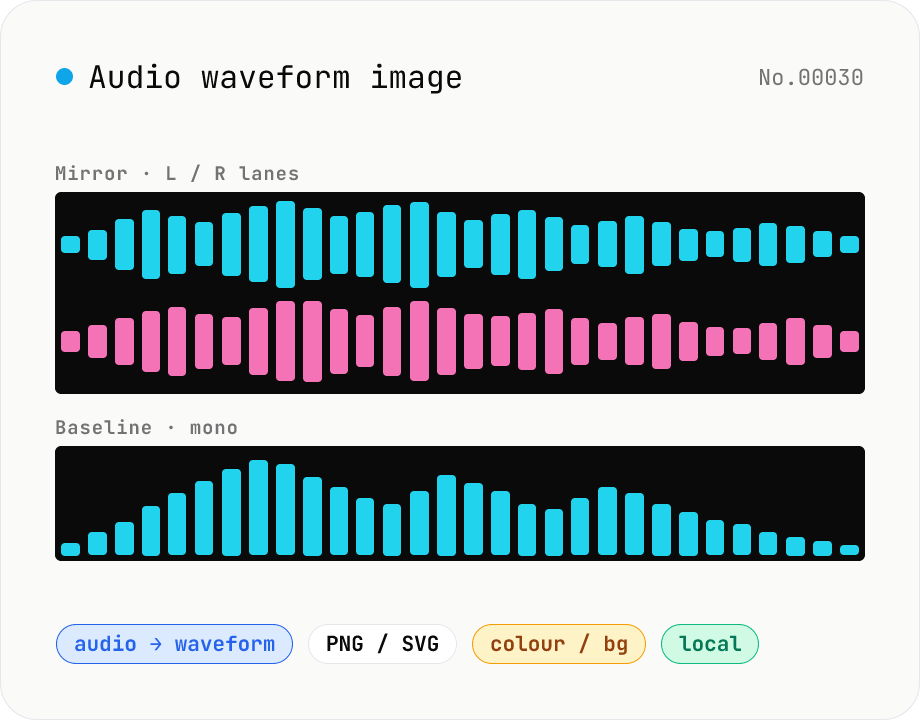
Audio waveform image — render waveform PNG / SVG in browser
Drop an audio file (MP3 / WAV / M4A / FLAC / OGG / Opus) to render its amplitude-over-time waveform on a Canvas and download as PNG or SVG. Mode toggle: mirror (top/bottom symmetrical, SoundCloud / Audacity style) or baseline (top-only, minimal). Options: stroke colour (HEX), background colour (HEX or transparent), canvas width (480 / 720 / 1080 / 1440 px), and whether stereo files render as two L/R lanes or are mixed to mono. Useful for podcast covers, thumbnails, broadcast OG images, zine layouts, or just sanity-checking the S/N of a lecture recording. Audio stays in your browser.