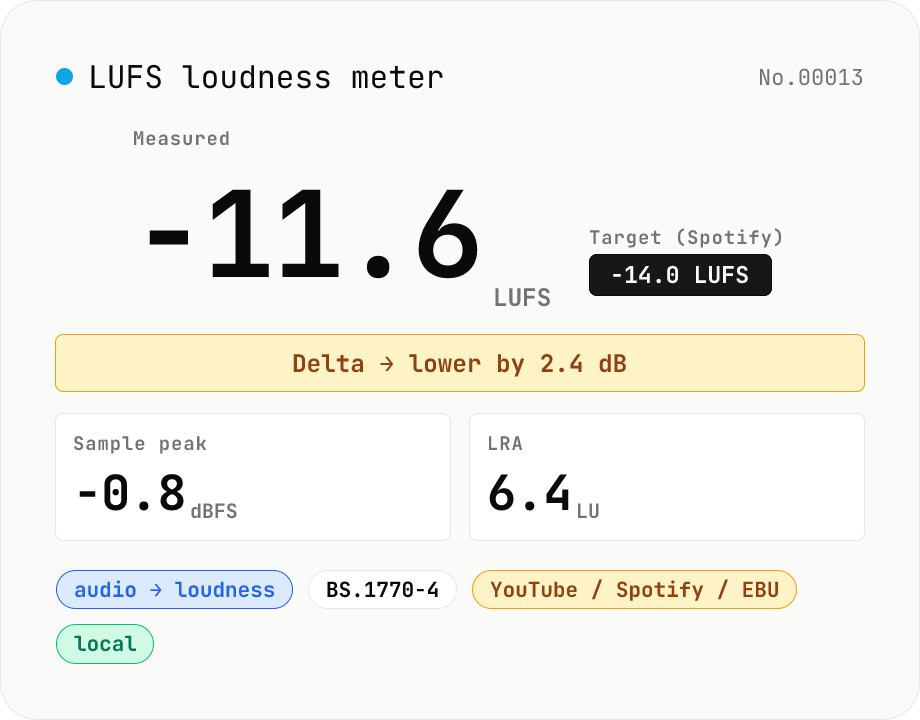
LUFS loudness meter — measure integrated loudness vs. streaming targets
Drop an audio file (MP3 / WAV / M4A / FLAC / OGG / Opus) to measure ITU-R BS.1770-4 Integrated Loudness (LUFS) / Loudness Range (LRA) / Sample Peak (dBFS) in your browser. Pick a streaming target (YouTube / Apple Music / Amazon Music: -14 LUFS, Spotify: -14 LUFS, Apple Podcasts: -16 LUFS, EBU R128 / broadcast: -23 LUFS) to see the delta in LU — telling you how many ±dB to push through audio-volume to match. Implements a K-weighting biquad, 400 ms square-window blocks, and absolute (-70 LUFS) + relative (-10 LU) gating, with ITU channel weights (L=R=C=1). Audio stays in your browser.
How to use
Drop or pick one or more audio files (MP3 / WAV / M4A, etc.). Pick the streaming target you want to match (YouTube / Spotify: -14 LUFS, Apple Podcasts: -16, EBU R128 / broadcast: -23). Measurement starts automatically. Each file shows Integrated LUFS, Sample Peak, LRA, and the delta from target. If the file is louder than target you'll see 'lower by X dB to match'; if quieter, 'raise by X dB'. Feed that value straight into audio-volume to align with your platform's playback normalisation.
In depth
Loudness measurement happens at the most sensitive point in the pipeline
Checking Integrated LUFS is a pre-release step. The file on the table is the current best master — the mix that will go live. An online tool that receives this file for analysis gets your most polished work at its most final stage.
Loudness numbers also carry structural information about the audio. A wide LRA signals a dynamic, acoustic-style recording; a narrow LRA with high Integrated LUFS is typical of heavily compressed electronic music. The measurement result alone reveals something about the nature of the work — and retaining it on a server means retaining that characterisation.
What happens when you send your master to a free online loudness checker
Server-side loudness checkers need the full audio payload to compute anything — loudness is an average over the entire duration. That means ‘just checking the LUFS’ and ‘uploading the master file’ are the same event. The operational feeling (no transformation, just a number) understates the data exposure.
Terms of service for free tools frequently permit use of uploaded content for service improvement. Whether that applies to audio files in practice, and what ‘service improvement’ covers, is rarely spelled out. For a master that hasn’t been released, the window between upload and distribution is exactly when you most want control over where the file has been.
K-weighting biquad and OfflineAudioContext — ITU-R BS.1770 inside the browser
The tool decodes audio with decodeAudioData, resamples to 48 kHz via OfflineAudioContext, then applies a two-stage K-weighting filter: a high-frequency shelving filter and a DC-block filter, as specified in ITU-R BS.1770-4. Instantaneous power is collected in 400 ms gating blocks; relative gating (-70 LKFS absolute threshold then -10 LU relative) produces the Integrated Loudness figure. LRA comes from the spread of the short-term loudness (3-second window) distribution.
The entire computation lives in browser memory. Open DevTools Network and measure a file: no audio-related requests after the initial load. The source — including the biquad coefficient calculation — is on GitHub.
Building a loudness check into your pre-release routine
Running a file through loudness analysis before export catches the mismatch between your intended sound and what streaming platforms will normalise to. A master pushed significantly above -14 LUFS gets pulled back by Spotify and YouTube; the relative spaciousness and dynamics you mixed for change in ways that weren’t auditioned. Catching this in the browser, without the file leaving your machine, is the lowest-friction version of that check.
Pair LUFS measurement with audio-true-peak for a complete pre-delivery assessment. Sample Peak can read clean while the reconstructed waveform (inter-sample) goes above 0 dBTP after MP3 / AAC encoding. Checking both before uploading to a distributor avoids the clipping artefacts that only appear post-transcode. If the integrated value misses the target, audio-volume applies a static gain in seconds; audio-waveform and audio-spectrum are useful side-checks when you want to see what the meter is responding to.
Inside ITU-R BS.1770 — why K-weighting beats plain RMS
Loudness measurement is not plain RMS — it operates on power that has first been routed through K-weighting, a perceptual frequency curve. The BS.1770 K-weighting filter is two biquads in series: (1) a stage 1 RLB filter that high-passes around 38 Hz to suppress DC and very low-frequency rumble that contributes nothing to perceived loudness, and (2) a stage 2 high-shelf that adds about +4 dB above 1.5 kHz. The shelf reflects how the ear weighs the 2–4 kHz band (the consonant range) more heavily than lows or extreme highs, so bass-heavy material can’t game the meter by piling on inaudible low energy.
The Integrated Loudness algorithm collects K-weighted power in 400 ms rectangular blocks, then applies two-stage gating: (a) drop blocks below the -70 LUFS absolute threshold (silent regions), then (b) drop blocks below -10 LU relative to the running mean (quiet passages). Loudness Range (LRA) comes from the spread of short-term (3-second window) loudness between the 10th and 95th percentile. Roughly: LRA = 3–5 is hyper-compressed EDM, LRA = 8–12 is mainstream pop, LRA = 15–20+ is classical or film. Stereo uses ITU channel weights (L=R=C=1.0, Ls=Rs=1.41); this tool supports the stereo case (L=R=1).
Platform targets and what normalisation actually does
The current major streaming targets are Spotify -14 LUFS, YouTube -14 LUFS, Apple Music -16 LUFS, Amazon Music -14 LUFS, Apple Podcasts -16 LUFS, TIDAL -14 LUFS, broadcast EBU R128 -23 LUFS, and US terrestrial ATSC A/85 -24 LKFS. A master exceeding the target (say -9 LUFS for Spotify) gets attenuated by -5 dB on the platform side. Hugely under the target (say -22 LUFS on Spotify with the Loud profile) can be auto-gained up, potentially pushing True Peak above 0 dBTP and clipping.
Pitfalls to know: (a) each platform’s normalisation is opt-in/opt-out (Spotify Premium’s loudness setting, Apple Music Sound Check), so listeners with normalisation off get the original level, (b) Album mode (Spotify, Apple Music) normalises to the album’s peak Integrated Loudness rather than per-track, leaving quiet tracks at their natural level inside the album, (c) podcast targets at -16 LUFS are quieter than music, so inserted music beds can feel disproportionately loud, (d) loudness normalisation does not guarantee True Peak ≤ -1 dBTP, so always pair LUFS with audio-true-peak. A typical routine: if the delta against your -14 LUFS target reads +3 LU, apply -3 dB with audio-volume and re-check True Peak before publishing.
FAQ
- LUFS vs. dBFS — what's the difference?
- dBFS measures the raw sample peak (0 = digital full scale). LUFS routes the signal through a K-weighting filter that approximates human hearing, so it correlates with perceived loudness. A bass-heavy track can read louder in LUFS even if its dBFS peak is moderate.
- Why is -14 LUFS so common?
- Spotify / YouTube / Apple Music / Amazon Music all normalise playback around -14 LUFS. Mastering to that target means the platforms transmit your mix balance as intended. Pushing past -14 just gets pulled back down, so loudness wars rarely pay off — the mix itself has to compete.
- What does LRA (loudness range) tell me?
- It quantifies the dynamic range — the distance between quiet and loud passages — in LU. 1–5 LU is heavily compressed / mastered material (EDM, hip-hop), 6–10 LU is mainstream pop / rock, and 10+ LU is typical of dynamic genres like classical or jazz.
- Can it measure True Peak (dBTP)?
- Right now we only show Sample Peak (dBFS). True Peak requires 4x oversampling and is heavier in-browser; Sample Peak still surfaces obvious clipping after MP3 / AAC encoding. For strict dBTP compliance use a dedicated DAW plugin alongside.
- Is the audio uploaded?
- No. We use the Web Audio API (decodeAudioData + an OfflineAudioContext at 48 kHz) plus an in-browser K-weighting biquad. Nothing leaves your machine.
How to verify nothing is uploaded
This tool never sends your input outside your browser. The pages below explain how it works, how to audit it, and how the site is run.
Related tools
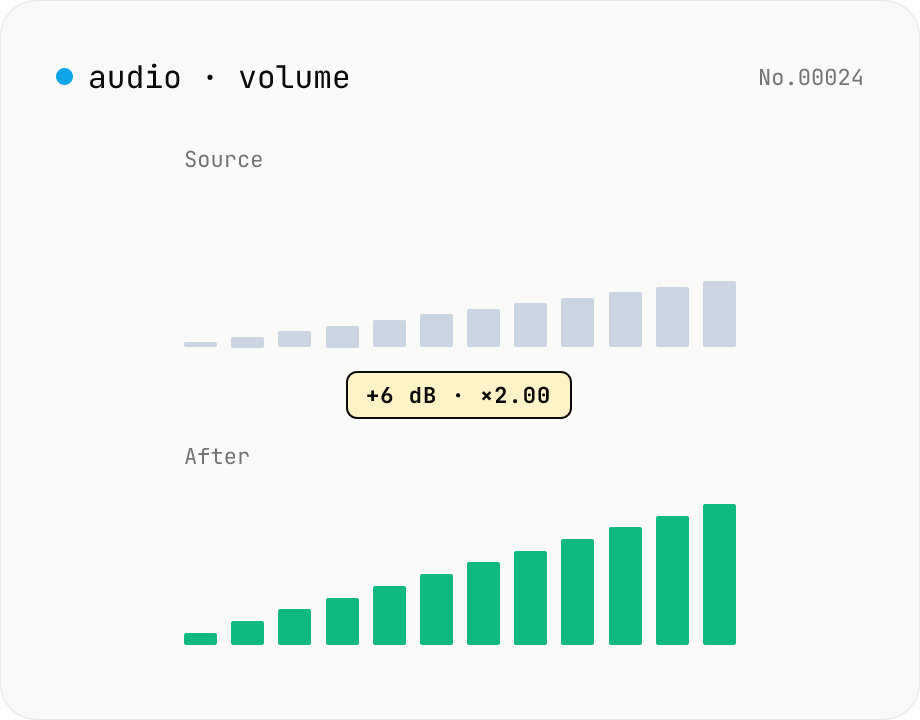
Audio volume — adjust by dB or linear multiplier
Adjust the loudness of audio files in bulk via ffmpeg.wasm's volume filter. Use the dB slider (-30 to +30 dB) or the linear multiplier (×0.03 to ×31.6). +6 dB ≈ 2x, -6 dB ≈ half. To avoid clipping, try negative values first and compare. Supports batch processing and a single ZIP download. Runs entirely in your browser — audio never leaves your device.
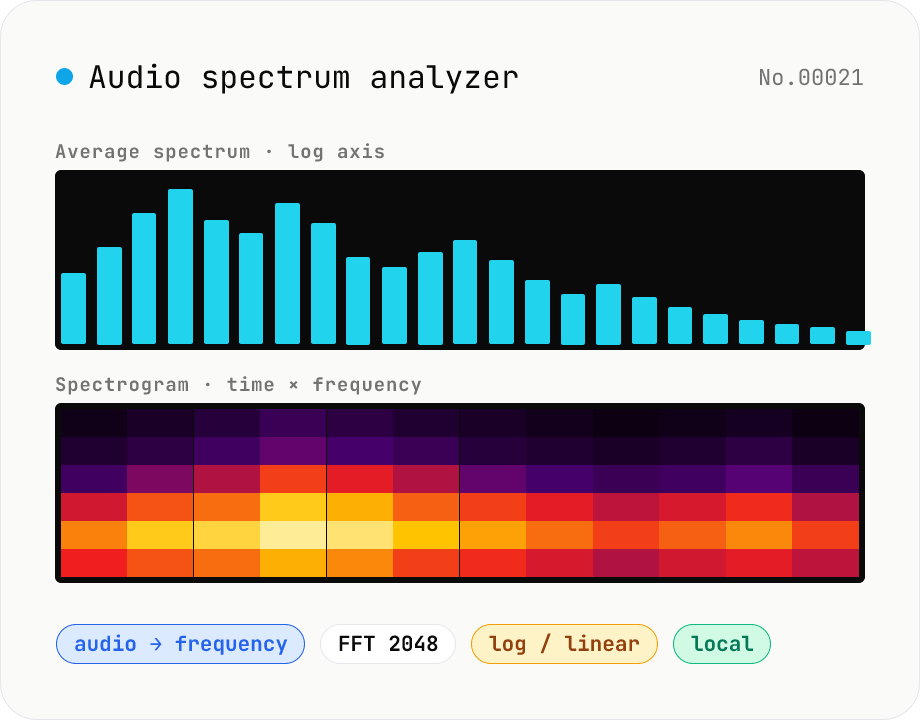
Audio spectrum analyzer — visualize frequency content
Drop an audio file (MP3 / WAV / M4A / FLAC / OGG / Opus) to run an in-browser FFT analysis and visualize its frequency content. A Mode toggle switches between the average spectrum (frequency vs. amplitude over the whole file) and a spectrogram (time × frequency × amplitude). Pick the FFT size (512 / 1024 / 2048 / 4096) and the frequency axis (linear / log). Useful for checking the low end before mastering, locating noise bands, inspecting an instrument's harmonic structure, or sanity-checking the S/N ratio of a lecture recording. Download the canvas as PNG, or export the average spectrum as CSV. Everything runs in your browser — no upload.
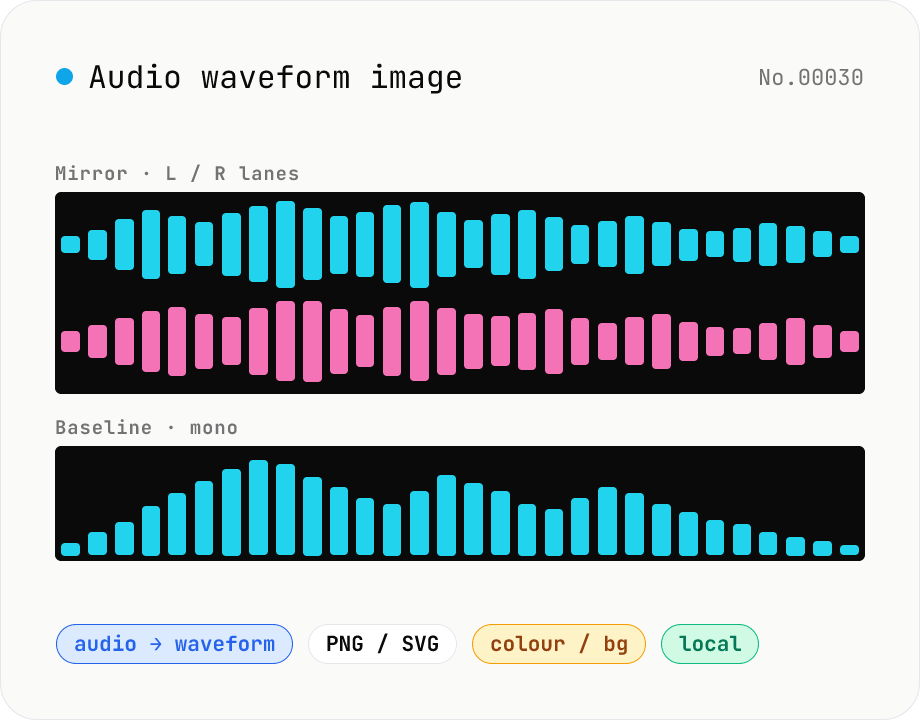
Audio waveform image — render waveform PNG / SVG in browser
Drop an audio file (MP3 / WAV / M4A / FLAC / OGG / Opus) to render its amplitude-over-time waveform on a Canvas and download as PNG or SVG. Mode toggle: mirror (top/bottom symmetrical, SoundCloud / Audacity style) or baseline (top-only, minimal). Options: stroke colour (HEX), background colour (HEX or transparent), canvas width (480 / 720 / 1080 / 1440 px), and whether stereo files render as two L/R lanes or are mixed to mono. Useful for podcast covers, thumbnails, broadcast OG images, zine layouts, or just sanity-checking the S/N of a lecture recording. Audio stays in your browser.
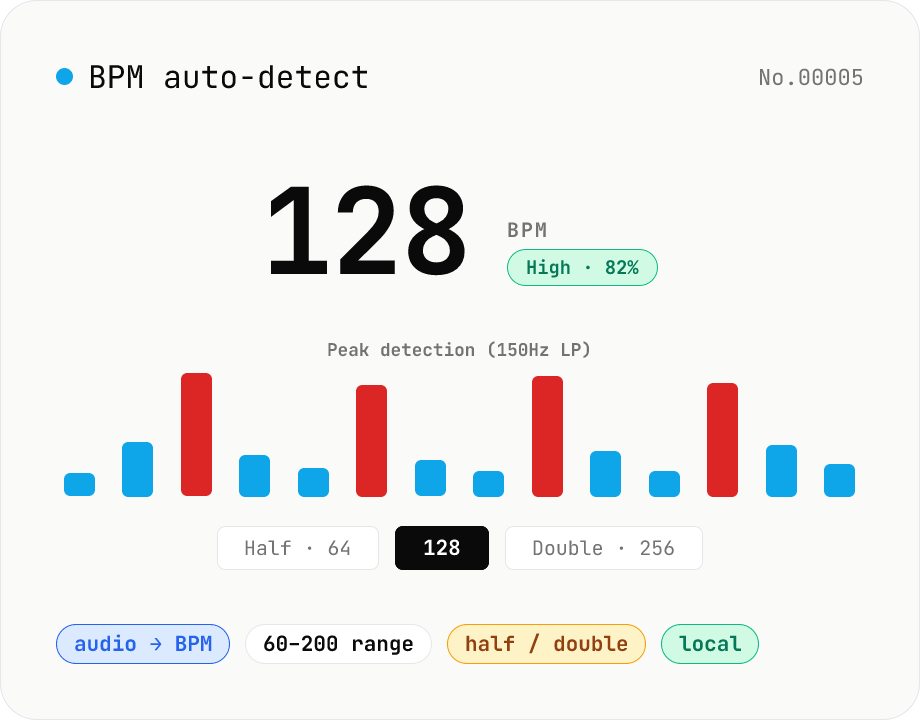
BPM auto-detect — estimate the tempo of an audio file
Drop an audio file (MP3 / WAV / M4A / FLAC / OGG) and we estimate the BPM in-browser using a low-pass filter + peak picker + histogram. Great for finding the tempo of a DJ partner track, checking sample packs, matching dance / running cadence, or grabbing a source BPM before running bpm-time-stretch. Half-tempo and double-tempo candidates are also shown so you can override 4-on-the-floor misreads (60 vs. 120). Everything stays in your browser.