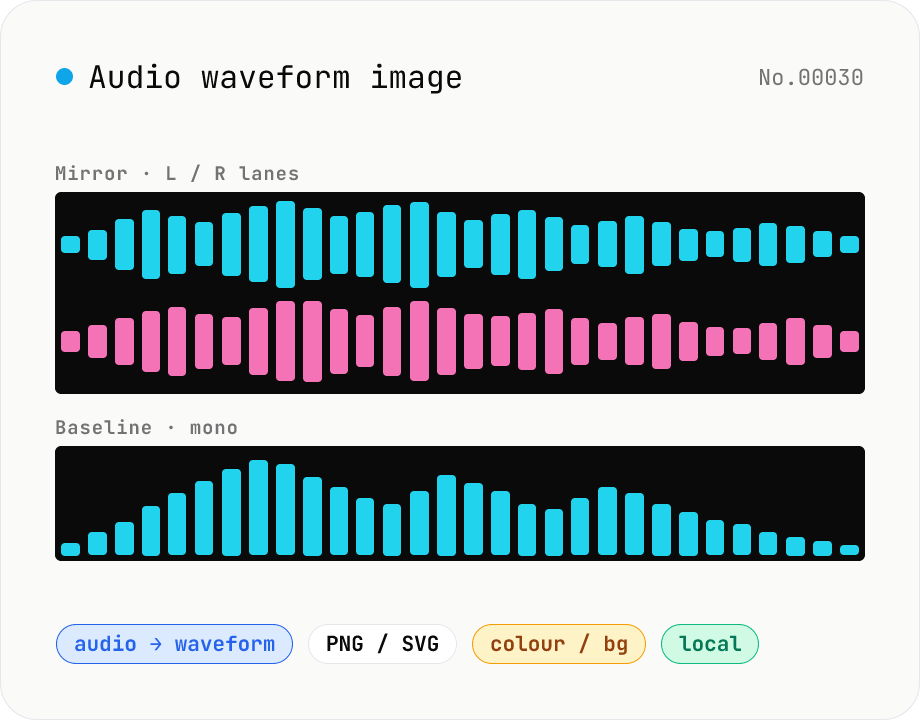
Audio waveform image — render waveform PNG / SVG in browser
Drop an audio file (MP3 / WAV / M4A / FLAC / OGG / Opus) to render its amplitude-over-time waveform on a Canvas and download as PNG or SVG. Mode toggle: mirror (top/bottom symmetrical, SoundCloud / Audacity style) or baseline (top-only, minimal). Options: stroke colour (HEX), background colour (HEX or transparent), canvas width (480 / 720 / 1080 / 1440 px), and whether stereo files render as two L/R lanes or are mixed to mono. Useful for podcast covers, thumbnails, broadcast OG images, zine layouts, or just sanity-checking the S/N of a lecture recording. Audio stays in your browser.
How to use
Drop or pick one or more audio files (MP3 / WAV / M4A, etc.). Pick a render mode (mirror or baseline) and tweak width / height, stroke colour and background. Stereo files can be drawn as two L / R lanes (stacked) or mixed down to mono. Rendering re-runs automatically when you add files or change settings. Hit the PNG / SVG button to download the current waveform. Uncheck the background to export transparent PNG / SVG.
In depth
Waveform generation happens on audio that hasn’t been published yet
Waveform visualisations are made for covers and thumbnails — the SoundCloud player image, the podcast episode artwork, the music blog embed. These are created at the stage when the audio is finalised but not yet distributed. The file that goes into a waveform generator is typically a completed mix or master.
Generating a waveform requires reading the full audio. The result is a visual abstraction of the amplitude over time, but the source material — every sample of the recording — had to pass through whatever system did the computation. An online tool that draws your waveform on its server has received your recording in full.
What gets handed over to cloud waveform services
Dedicated waveform-image generators are a niche tool, but general-purpose audio utilities sometimes include this feature. When the computation is server-side, the audio arrives at the service’s infrastructure. The waveform rendering decision (mirror vs. baseline, colours, dimensions) may trigger multiple requests, each carrying the audio.
The rendered waveform image doesn’t contain the audio directly, but the waveform pattern encodes the dynamic structure of the recording — where the loud and quiet sections are, how the energy is distributed, whether there are distinctive amplitude signatures. That pattern, stored alongside metadata, is a derived fingerprint of the recording.
decodeAudioData feeds Canvas 2D and SVG polyline — entirely in the browser
The tool decodes audio with decodeAudioData, downsamples the sample array (computing RMS per pixel-width block), and draws the waveform using Canvas 2D: mirror mode reflects the waveform symmetrically around a centre axis; baseline mode draws amplitude as a vertical bar from a fixed baseline. SVG output produces a \<polyline> element — a resolution-independent vector that can be resized or recoloured in Figma or Illustrator. Transparent PNG uses Canvas.toBlob('image/png') with no background fill. Every rendering step runs inside browser memory.
Open DevTools Network and drop a file: no audio requests appear after the initial page load. Changing rendering parameters re-runs the downsampling against the already-decoded data — no refetch. The Canvas path and SVG serialisation are in the GitHub source.
Practical uses and what to keep in mind
SVG export is the better choice for anything going into a design pipeline. The polyline can be scaled to any size, recoloured to match brand guidelines, and embedded in a vector document without rasterising. PNG is convenient for direct web use — a SoundCloud-style player embed, a social preview image. To pair the visual with the underlying analysis, audio-spectrum shows the same audio in the frequency domain and audio-bpm-detect reports the tempo, both inside the same browser session.
The audio file stays on your machine throughout. Only the waveform image leaves the browser — as a download, not an upload. This makes the sharing question simple: distribute the image, keep the audio. The two don’t have to travel together.
Downsampling algorithms — RMS vs. peak vs. min-max
Rendering 1080 px of waveform from three minutes of audio (about 8 million samples) requires bucketing ~7,400 samples per pixel. The choice of which value represents each bucket changes the visual character. RMS (Root Mean Square), sqrt(Σ x²/n), gives an average-energy view that smooths over instantaneous spikes and represents perceived loudness reasonably well. That’s the approach this tool uses.
Peak — max(|x|) per bucket — preserves transient spikes and produces the angular SoundCloud / Audacity look. Min-Max stores [min(x), max(x)] per pixel, giving a faithful top-and-bottom envelope that matches what Audacity shows at high zoom levels. Each method interprets the same audio differently. RMS is good for design (smooth and dynamic-aware), peak is good for analysis (catches clipping locations precisely), and min-max is good for editing (preserves the literal vertical symmetry of the waveform).
Choosing SVG over PNG for branding and long-lived assets
PNG is rasterised — it locks in the export resolution (480 / 720 / 1080 / 1440 px). For direct sharing on Twitter or Instagram, or for embedding in a blog post with <img>, PNG is the simpler path. SVG is vector-based: stroke colour, line weight, gradients, filter effects can all be modified later in Figma, Illustrator, or Sketch. For brand rebrandings, regenerating an entire podcast series’ covers, or repurposing waveforms for zines, liner notes, or posters, the option to re-edit later makes SVG the longer-lived asset.
By file size, a three-minute waveform at 1080 px wide produces an SVG polyline of around 2,160 points (or 4,320 in mirror mode) totalling roughly 25–50 KB. The same dimensions as transparent PNG run 50–200 KB depending on density, and opaque PNG ranges from 100–300 KB. For thumbnails where load time matters, SVG is both lighter and infinitely scalable. Transparent PNG remains useful when you need a SoundCloud-style player embed with a background colour driven by surrounding CSS rather than baked into the asset.
FAQ
- How long an audio file can I render?
- Anything up to an hour or so is fine in-browser, but the canvas width is fixed so more samples get packed per pixel. Bump the width to 1440 px or 1080 px when you need to see detail in long recordings.
- When should I pick mirror vs baseline?
- Pick mirror for music / podcast covers (the SoundCloud look). Pick baseline when the waveform is small (thumbnails, icons) — it stays readable. If you're recreating an Audacity-style image, use mirror.
- PNG vs SVG?
- PNG is fixed-size raster, ideal for web. SVG is a vector polyline so it scales cleanly for print and oversized banners, and you can edit the line in any vector tool.
- Can I render the L / R channels separately?
- Yes — pick 'show L / R as two stacked lanes' to render them in the same image. If you need them as completely separate files, run audio-channel-split first then analyze each mono file individually.
- Is any audio uploaded?
- No. We decode via the Web Audio API (decodeAudioData) and render via Canvas / SVG before producing a Blob. Nothing is uploaded.
How to verify nothing is uploaded
This tool never sends your input outside your browser. The pages below explain how it works, how to audit it, and how the site is run.
Related tools
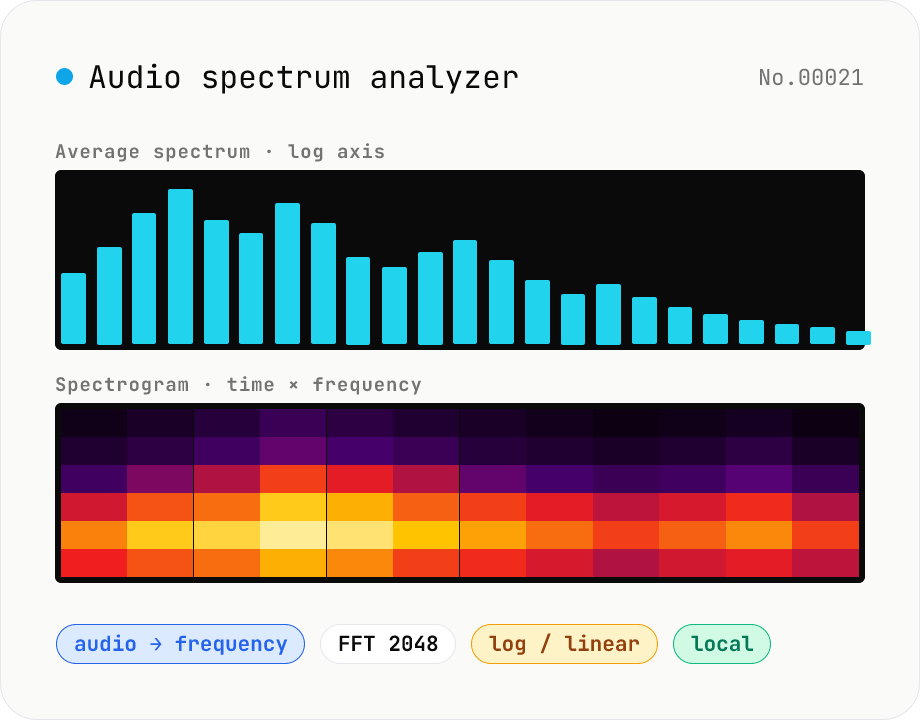
Audio spectrum analyzer — visualize frequency content
Drop an audio file (MP3 / WAV / M4A / FLAC / OGG / Opus) to run an in-browser FFT analysis and visualize its frequency content. A Mode toggle switches between the average spectrum (frequency vs. amplitude over the whole file) and a spectrogram (time × frequency × amplitude). Pick the FFT size (512 / 1024 / 2048 / 4096) and the frequency axis (linear / log). Useful for checking the low end before mastering, locating noise bands, inspecting an instrument's harmonic structure, or sanity-checking the S/N ratio of a lecture recording. Download the canvas as PNG, or export the average spectrum as CSV. Everything runs in your browser — no upload.
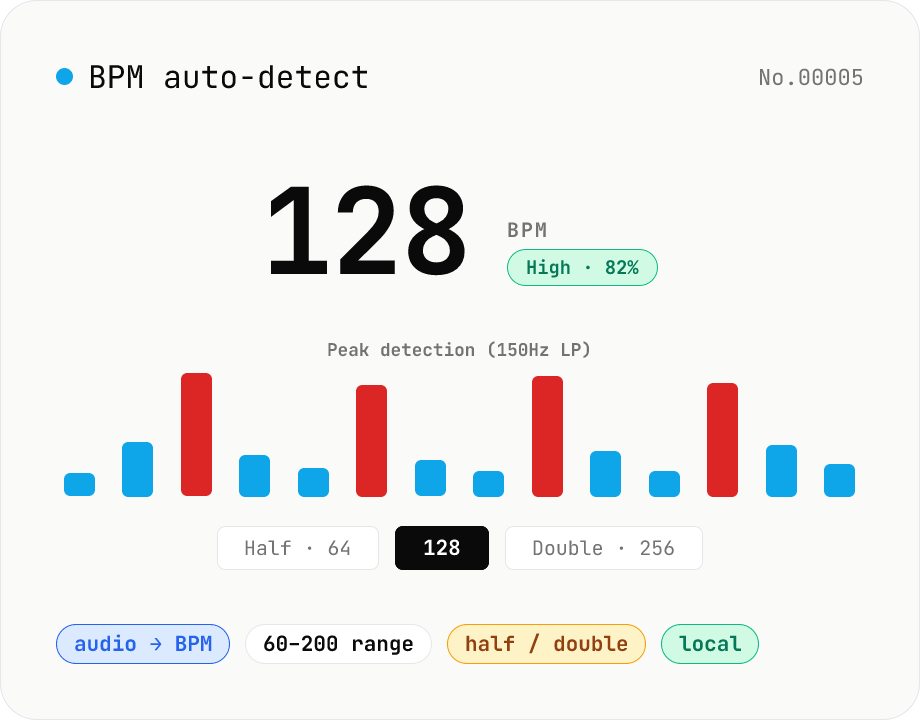
BPM auto-detect — estimate the tempo of an audio file
Drop an audio file (MP3 / WAV / M4A / FLAC / OGG) and we estimate the BPM in-browser using a low-pass filter + peak picker + histogram. Great for finding the tempo of a DJ partner track, checking sample packs, matching dance / running cadence, or grabbing a source BPM before running bpm-time-stretch. Half-tempo and double-tempo candidates are also shown so you can override 4-on-the-floor misreads (60 vs. 120). Everything stays in your browser.
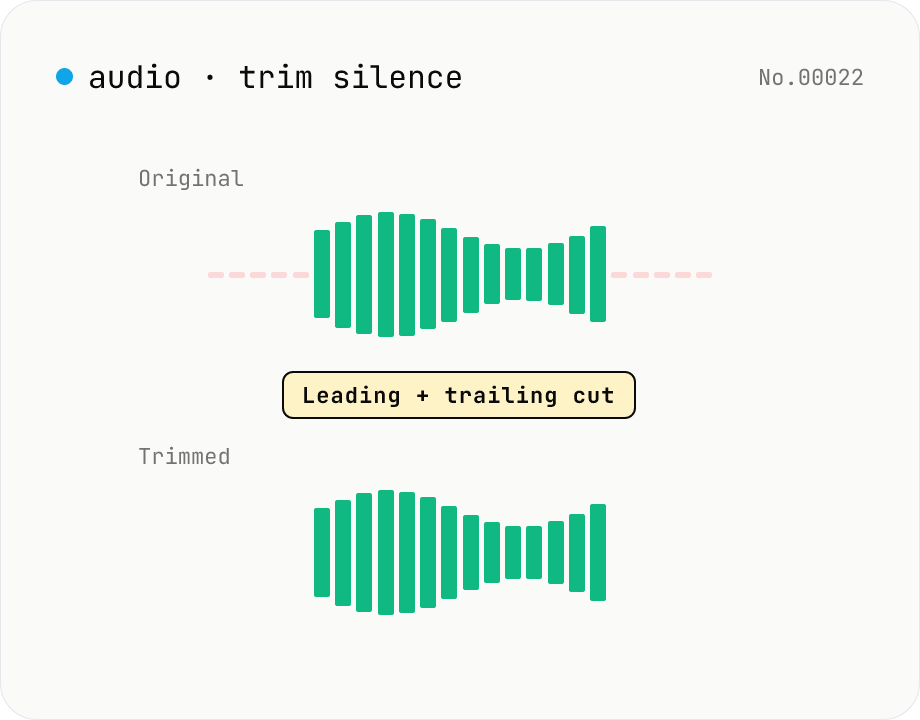
Trim silence from audio — auto-cut leading and trailing silence (ffmpeg.wasm)
Automatically trim the leading and trailing silence from MP3 / WAV / M4A / AAC / OGG / OPUS / FLAC files using ffmpeg.wasm's silenceremove filter. Great for removing dead air at the start of recordings, the awkward pause before a talk, or an unnecessarily long fade-out at the end of a podcast. Tweak the threshold (dB) and minimum silence length (seconds) and choose which side(s) to trim. Batch process and grab a single ZIP. Files never leave your device — every step runs in the browser.
Audio format convert — MP3 / WAV / M4A / OGG / FLAC
Convert audio files to mp3 / wav / m4a / ogg / flac. ffmpeg.wasm picks an encoder based on the chosen extension and re-encodes the file entirely in your browser. Supports batch processing and a single ZIP download.